🚚 Chapter 9: Implementation Roadmap
By this stage, you’ve shortlisted your vendor, aligned stakeholders, and approved budgets.
Now comes the part where most projects either create lasting control… or devolve into “we’ll fix it later” folklore.
This chapter gives you a practical, cross-industry implementation roadmap that works for:
- Pharma / biotech / healthcare
- Frozen & chilled food / retail
- Cold chain logistics
- Data centres & server rooms
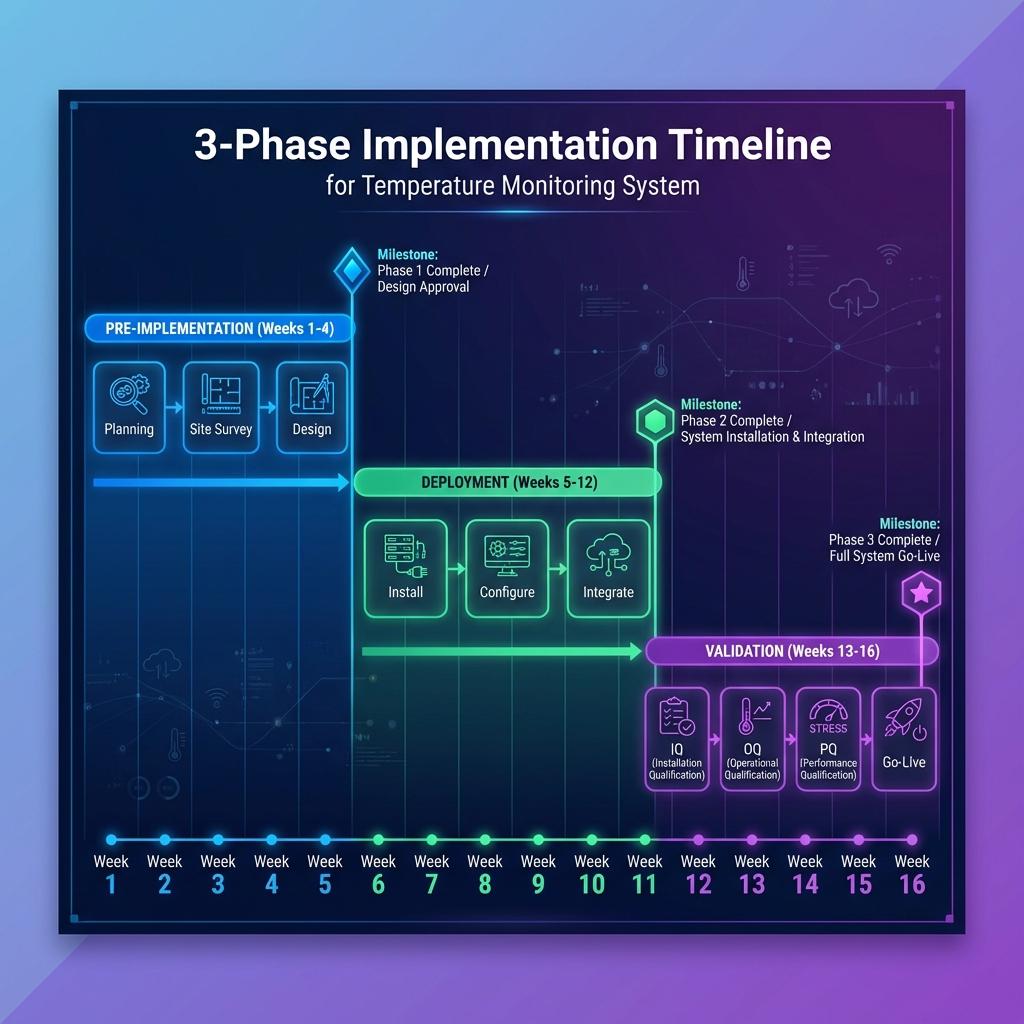
The roadmap is structured into three phases:
- Pre-Implementation Planning – reduce surprises before anyone touches a wall with a drill.
- Deployment – install, connect, and train with discipline.
- Validation & Audit Preparation – convert a working system into a defensible one.
9.1 Pre-Implementation Planning
Objective: turn “we bought a system” into “we have a controlled implementation plan” before boxes arrive on-site.
You’re aligning three things:
- Design – what must happen, where, and to what standard.
- Reality – what sites actually look like and how people really work.
- Resources – sensors, loggers, people, and time.
9.1.1 Mapping Protocol Approval
You do not start deploying monitoring probes by “putting a sensor where it looks nice”. Mapping protocol approval is the first hard gate.
Why this matters
- It links your risk assessment to your measurement plan.
- It defines how you will prove that your environment is controlled.
- It becomes part of your validation and audit pack.
Key elements of a mapping protocol
At a minimum, per environment class (warehouse, cold room, reefer, cabinet, data hall, server room):
- Objective & scope
- Which spaces / assets are in scope.
- What product, patient, food safety, or uptime risk is being protected.
- Environment description
- Dimensions, layout, racking, door locations, refrigeration / HVAC details.
- Special features (mezzanines, hot/cold aisles, blast zones, sensitive equipment).
- Test conditions
- Loading state (empty / partially loaded / fully loaded).
- Door-opening pattern (for cold rooms, reefers, retail cabinets).
- Seasonal considerations (e.g., worst-case ambient season).
- Instrumentation plan
- Number of loggers/sensors and their proposed locations (with layout diagrams).
- Logger specifications (accuracy, calibration status, sampling interval).
- Test duration & acceptance criteria
- Minimum duration (e.g., 24–72 hours or more, depending on environment).
- Criteria for pass/fail (percentage of time in range, maximum allowed excursion, recovery times).
- Data analysis approach
- How data will be processed (statistics, summary reports, identification of hot/cold spots).
- Roles & responsibilities
- Who approves the protocol (Quality lead).
- Who executes (Engineering / vendor / mapping team).
- Who reviews the report and implements recommendations.
Approval best practice
- Quality / Validation owns final sign-off.
- Operations, Engineering, Logistics, Data Centre Ops review feasibility and practicality.
- IT is involved if temporary mapping devices interface with the monitoring platform.
Once protocols are approved, you lock them and manage changes via formal change control.
9.1.2 Site Walkthroughs
Even the best protocol will fail if it assumes a reality that doesn’t exist. Site walkthroughs are where theory meets concrete.
Purpose
- Confirm that the protocol assumptions match what exists on the ground.
- Identify practical constraints that will affect installation and mapping.
- Build rapport between project team and site teams (crucial for adoption).
What to look at during walkthroughs
| Area / Topic | What You’re Checking For |
|---|---|
| Physical layout | Room dimensions, rack heights, dead corners, door counts, access points, cabling routes |
| Equipment & utilities | Location of evaporators, AHUs, CRAC units, control panels, UPS / generator coverage |
| Environmental risks | Areas prone to condensation, icing, drafts, direct sunlight, roof exposure, heat sources |
| Operational patterns | Loading/unloading flows, door-open frequency, high-traffic times, picking routes |
| IT / network infrastructure | Available power, network points, Wi-Fi coverage, existing fieldbus/BMS/DCIM connections |
| Safety & access | Work-at-height constraints, cold-room PPE requirements, server room access control, safety permits |
Deliverables from walkthroughs
- Updated layout diagrams with proposed sensor/logger positions marked.
- List of constraints (e.g., “cannot drill here”, “no cable trays on this wall”).
- Early list of enablers (e.g., “we can piggyback on existing cable routes” or “existing BMS panel can host new signals”).
- Confirmed installation windows (non-peak times, maintenance shutdowns, etc.).
Document all this; it will save you from painful “but we didn’t know” moments later.
9.1.3 Sensor & Logger Allocation
Now you move from “we need ~50 sensors” to “which device goes exactly where, and in what status”.
Key steps
- Build an asset register (even before installation)
- Unique IDs for all sensors, loggers, gateways, and key network devices.
- Manufacturer, model, serial number.
- Calibration status and next-due date.
- Map devices to environments
- Assign which device will go to which environment and approximate location, using the maps from 9.1.2.
- Keep spares identified and calibrated for contingencies.
- Check calibration status
- All devices used for mapping and regulated monitoring must have valid calibration at the time of use.
- Any device with calibration expiring mid-project must be flagged and either recalibrated or swapped in advance.
- Pre-configure where possible
- Set device IDs, sampling intervals, and basic configuration before going onsite.
- Label devices physically to match their digital IDs (stickers, engraved tags, barcodes, etc.).
Output
- A Sensor & Logger Allocation Sheet that lists:
- Device ID → Environment → Planned location → Calibration due date → Owner.
- This sheet later becomes part of your IQ documentation.
9.2 Deployment
Objective: install and connect everything with discipline, not improvisation.
The golden rule: install according to mapping, not convenience.
9.2.1 Installation Best Practices
Installation rules differ slightly by environment, but the principles are universal.
General rules
- Follow the mapping-derived plan for probe positions. Do not move sensors because “this looks easier” without approval.
- Ensure mechanical stability – sensors shouldn’t swing, vibrate, or be easily bumped.
- Avoid locations where sensors are exposed to direct radiant cooling/heating that doesn’t represent product or air mass (e.g., directly in front of vents, touching evaporator coils, glued to a hot server casing unless that’s intentional).
- Protect devices and cables from mechanical damage, forklift traffic, and cleaning operations.
Environment-specific installation notes
- Warehouses & distribution hubs
- Mount sensors at the validated worst-case rack positions (usually high and distant from air inlets), not just at head height.
- Use fixed brackets or rails on racks; avoid hanging devices loosely.
- Cold rooms & freezers
- Keep sensors in the airflow path but not in direct line of coils or door gaps.
- Use appropriate IP-rated enclosures and mounting hardware that can handle low temperatures and icing.
- Stability chambers & incubators
- Follow qualification documents strictly for sensor placement.
- Minimise cable intrusion and ensure door seals remain effective.
- Reefers, trucks, passive shippers
- Position sensors to capture front/middle/rear, top/middle/bottom as per mapping.
- Ensure sensors are secured against vibration and product handling.
- Data centres & server rooms
- Place sensors at rack inlets (top/middle/bottom) according to thermal mapping.
- Keep cabling tidy and separated from power; avoid blocking airflow.
Installation documentation
- Take photos of all sensor locations during installation.
- Annotate site plans with final installed positions and device IDs.
- Capture any deviations from the original plan in a controlled deviation log for QA review.
9.2.2 Connectivity Verification
No, “the light is on” is not a connectivity test.
You need to verify end-to-end data flow from sensor to dashboard.
Stepwise verification
- Local device check
- Confirm each sensor/logger is powered and collecting data.
- If devices have local displays, verify readings are plausible.
- Gateway / controller check
- Confirm that each device is visible to the local gateway or controller.
- Check RSSI / link quality for wireless devices.
- Platform data check
- Confirm that readings appear in the central monitoring platform with correct:
- Device ID and environment mapping.
- Timestamp (correct time zone).
- Units (°C vs °F; avoid mixed environments).
- Confirm that readings appear in the central monitoring platform with correct:
- Alarm path check
- Simulate test alarms (e.g., by setting temporary limits) to verify:
- Alarm creation.
- Notification via email/SMS/app.
- Correct escalation behaviour.
- Ensure alarm tests are clearly marked in the system and not misinterpreted later.
- Simulate test alarms (e.g., by setting temporary limits) to verify:
- Resilience tests
- Intentionally disconnect network links (under controlled conditions) and confirm:
- Devices buffer data locally.
- Data re-syncs when connectivity returns.
- System clearly flags communication failures.
- Intentionally disconnect network links (under controlled conditions) and confirm:
Capture all of this in a Connectivity Verification Report; it becomes part of IQ/OQ evidence.
9.2.3 Training and SOP Rollout
If people don’t know how to use the system, it will become window dressing.
Audience-based training
- Operators / floor staff / warehouse & cold room teams
- Reading local indicators.
- Basic dashboard usage.
- Alarm response SOPs.
- Who to call when something looks wrong.
- QA / Validation / Quality Control
- Reviewing trends and exceptions.
- Running and interpreting reports.
- Reviewing and approving mapping and validation documents.
- Handling deviations and CAPAs related to temperature excursions.
- IT / Data Centre Ops / OT
- System administration.
- Backup and restore.
- User management.
- Monitoring system health and integrations.
- Management / CXO / Site Heads
- How to read high-level dashboards and KPIs.
- How to review periodic performance summaries.
SOP rollout essentials
For each site, ensure effective-date-approved SOPs exist and are communicated for:
- Mapping execution and reporting.
- Monitoring and alarm management.
- Calibration and device handling.
- User management and access rights.
- Backup, restore, and system emergency procedures.
Good practice
- Appoint local superusers per site/shift – people who can handle first-line issues.
- Maintain training records, including refresh cycles and new-joiner induction.
9.3 Validation & Audit Preparation
Objective: move from “it works” to “we can prove it works and stays under control”.
This is where the system becomes audit-ready and board-ready.
9.3.1 IQ/OQ/PQ Deliverables
You’re effectively validating two things:
- The monitoring system (hardware, software, network).
- The qualification of environments (via mapping and performance demonstration).
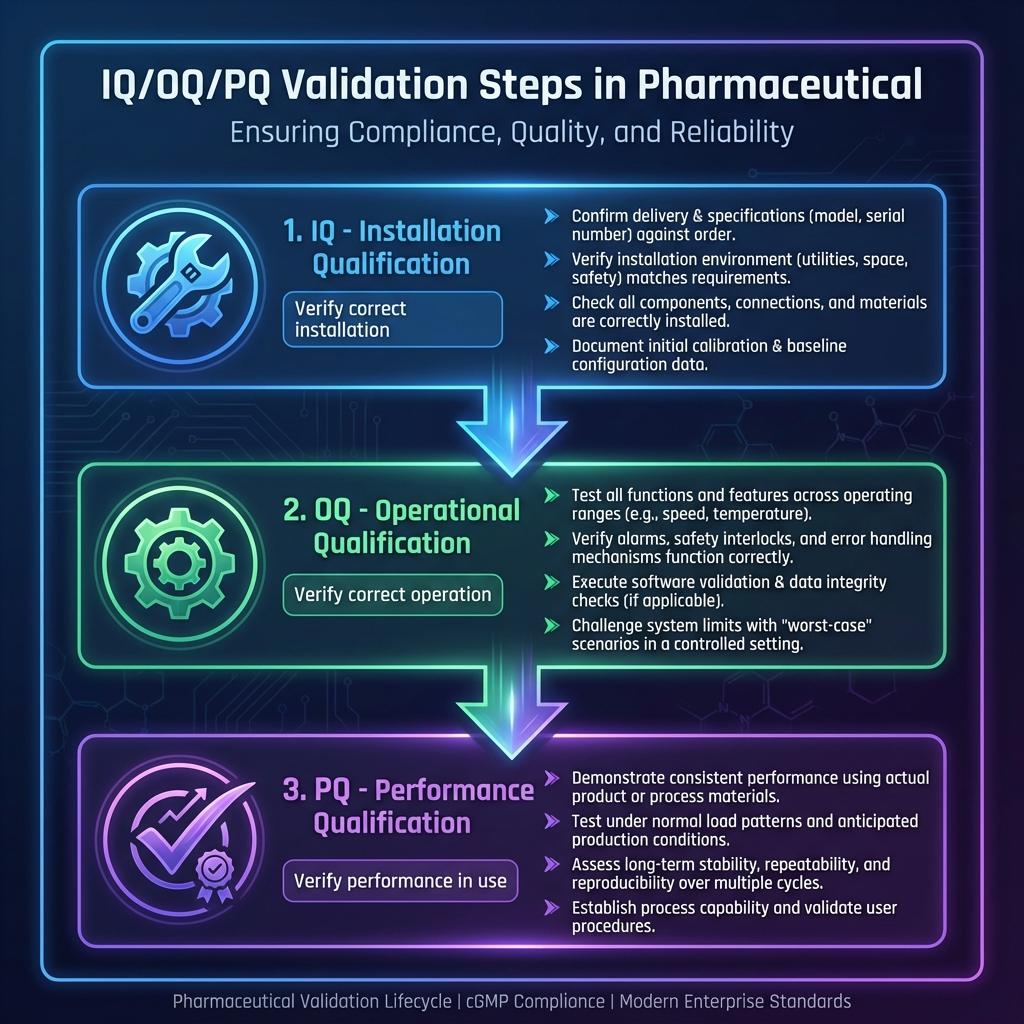
Installation Qualification (IQ)
IQ answers: “Did we install what we said we would, where we said it would go?”
Deliverables typically include:
- Hardware and software inventory (serials, versions, locations).
- Network diagrams and configurations.
- Calibration certificates and asset register.
- Records of installation checks and sign-off.
- Evidence of correct assignment of sensors → environments → dashboards.
Operational Qualification (OQ)
OQ answers: “Does the system function as intended under defined operating conditions?”
Deliverables include:
- Test scripts and results for:
- Data acquisition and display.
- Alarm creation, notification, and acknowledgement.
- User roles and permissions.
- Audit trail creation and review.
- Backup and restore trials.
- Deviation logs and resolutions for any failed test steps.
Performance Qualification (PQ)
PQ answers: “Does the system perform effectively and reproducibly in real-world use?”
Deliverables include:
- Mapping reports for representative environments confirming control within defined limits.
- Real-world monitoring data over an agreed time window (e.g., several weeks/months).
- Evidence of real alarms, responses, and investigations being handled according to SOPs.
- Confirmation that system performance meets URS and risk-based expectations.
All IQ/OQ/PQ documents should be linked back to your URS via a traceability matrix.
9.3.2 Deviation Management and CAPA
No implementation is flawless. What matters is how you recognise, document, and fix issues.
Types of deviations you should expect
- Installation deviations
- Sensor placed differently from plan due to physical constraints.
- Substitution of a different device model mid-project.
- Test deviations
- OQ step fails (e.g., alarm not sent to one notification channel).
- Data gap during connectivity testing.
- Performance deviations
- Mapping reveals unexpected hot/cold spots.
- Early PQ shows frequent nuisance alarms or slow responses.
Good deviation management practice
- Log all deviations with:
- Description and context.
- Immediate containment measures.
- Root cause analysis (where warranted).
- Corrective and preventive actions.
- Ensure deviations are:
- Reviewed and approved by QA.
- Linked to change control where system or process changes are needed.
- Closed in a timely manner before final validation sign-off.
Over time, your deviation and CAPA history will be one of the strongest indicators to auditors that you run a mature, self-correcting system.
9.3.3 Backup and Data Export Plans
Last, but absolutely not least: what happens if things go wrong, or if you change vendors in the future?
Backup strategy
- Define backup frequency for configuration and data (e.g., daily incremental, weekly full).
- Define storage locations (onsite/offsite, cloud, immutable backups where applicable).
- Perform test restores as part of OQ/PQ – not just theoretical “we could restore if needed.”
Data export and portability
You must be able to:
- Export monitoring data for defined time windows in usable formats (CSV, PDF, XML, etc.).
- Export key configuration data: site structure, device mapping, alarm rules.
- Provide investigators/auditors with focused exports (e.g., “all warehouse excursions in last 12 months”).
Audit preparation drill
Before declaring the system fully live:
- Conduct a mock audit where you simulate typical queries:
- “Show us the mapping report and monitoring data for this freezer over the last 6 months.”
- “Show us all alarms for Site X in Q2, and how you responded.”
- “Show us calibration status for all sensors in this warehouse.”
- Time how long it takes to retrieve, collate, and explain the data.
- Refine SOPs and training based on the drill.
How to Use Chapter 9
- As a project checklist for each site rollout.
- As an alignment tool between Quality, Operations, IT, Logistics, and Data Centre Ops before deployment starts.
- As a validation planning reference, ensuring nothing critical is forgotten between “we installed it” and “we can defend it.”
Get Chapter 9 right and your temperature mapping & monitoring solution stops being “a project” and becomes part of how your organisation runs safely, compliantly, and predictably—across pharma, food, logistics, and data centres alike.
Implementation Timeline
This flowchart shows the implementation phases and milestones: